SIMPLIFING PROCESSES WITH OUR END TO END DASHBOARDS
WHAT IS
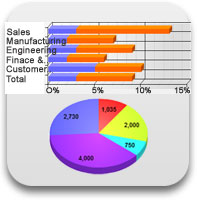
Medium to large enterprises generate data from millions and even billions of transactions every year and routinely store it off-line in large data storage facilities to create reports for the their user community. The data in these reports are usually displayed in rows and columns. Since most people understand information better through images, there is a need to represent the data in a graphical manner – i.e. a dashboard.
Just as a car dashboard provides drivers with information about speed, fuel level and temperature, a business dashboard similarly summarizes information graphically. Managers can visualize various parts of the business and quickly use that knowledge to make better decisions or change course.
It is a compressive collection of dashboards organized in a logical sequence. This following is an example of key core processes as they relate to an automotive manufacturing environment:
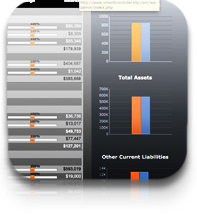
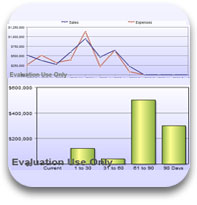
*Forecasting new period product quantities, net profit, income statement and balance sheet
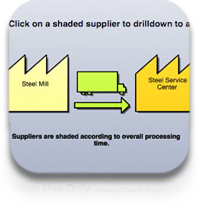
*Comprehensive Supply Chain Management from sourcing to production of the final products
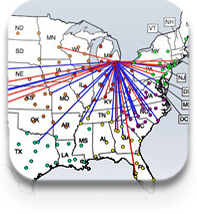
*Shipping manufactured products to various locations
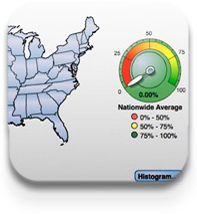
*Delivery to dealers who have visibility to end consumers
WHO SHOULD USE
The F 2C Enterprise Dashboard is best suited for medium to large enterprises with a staff of a few hundred or more looking to make changes that add value to their business while operating in a highly competitive environment.
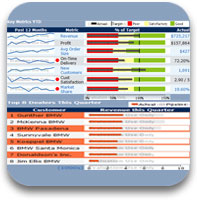
Back office systems generate a huge volume of data. C-Level executives need a system that both pulls and summarizes all relevant data for Key Performance Indicators (KPI) with alerts to support management by exception (MBE). A dashboard visually relates data at a level above the typical column and row spreadsheet report allowing managers to quickly process important business information and spark creativity to better understand the behavior of their business and to find innovative solutions.


WHY USE
Management must focus on various activities across the enterprise to stay competitive and need a tool that not only provides specific information, but can drill-down to answer deeper questions immediately.
KPI's F 2C Enterprise Dashboard meets flexible timing requirements such as real-time, daily, weekly, monthly, quarterly or yearly.
We are system integrators. We can integrate your current backend systems with visually rich front-end dashboards using agreed upon KPI.
NOTE ON DEMO
The Demo and description referes to a Car Manufacturer (BMW) with various series and models of automobiles. However, this is just an example, and our custom e-Dashboards can fulfill the needs of other industries in Manufacturing, Healthcare and Services.
In this Car Manufacturing demo there are 4 Core Processes - Forecast, Supply Chain, Shipping and Transportation and Retail Sales. Similarly, for Power Generation Company, while the Forecast process will remain same, the other 3 processes will change to Generation of Power, Transmission of Power and Distribution of Power.
Please do not hesitate if there are any question about the relevance of our Forecast2Cash process to your business.
CORE PROCESSES
TRANSPORTATION
SUPPORT PROCESSES
i.Headcount shows Target vs. ActualComparison staffing with drill-down by... read more...

read more...