SHIPPING TRANSPORTATION
a.
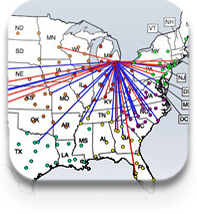
Lane Performance - shows shipping of manufactured Cars from the Manufacturing hub - DET (Detroit). The lanes are color-coded based on delays over the total distance.
i.
Worst Lane tab has 4 screens showing - Worst Regions- Miles Out of Route, All Regions Worst Lanes, % of Routes and 5 Worst Single Shipments. The Regions can be changed via selection drop-down
b.
Shipment Location is a powerful Dashboard having three main screens
i.
1. Where are my truck's, which is overlaid over the country map with each color-coded dot representing a truck carrying a specific model of cars. Also it has two drop downs1. Series (car model) and
2. Truck Number
ii.
The above linked to a Google Map showing the location of a truck.
iii.
The real-time weather map shows weather conditions over the country map, which can help explain the reasons for delays
c.
Revenue tap shows two screens showing - Today's and Weeks peformance as relating to Loads, Revenues and Margins