HUMAN CAPTIAL MANAGEMENT
a.
Summary
i.
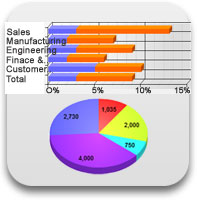
Headcount shows Target vs. ActualComparison staffing with drill-down by Region and Division
ii.
Average Revenue per Employee current value within a colored tachometer with drill-down showing stacked bars showing information by region over different time periods
iii.
Employee Satisfaction Survey shows region-based results with drill-down by Department
iv.
Headcount by Dept display current staffing by department with the drill-down showing the deviations from Targets
v.
Attrition Rates shows voluntary and involuntary separation with the drill-down showing global rates and separately 3 tenure-levels and 5 employee salary-level with cost-impact being displayed by pie-chart.
b.
Headcount
c.
Attrition
d.
Employee Satisfaction
e.
Compensation Planning has 3 tabs as follows:
i.
Salary Grade Distribution Report
ii.
Actual Salary by Performance Rating
iii.
Comparison Ratio by Performance Rating
f.
Performance Management has following tabs
i.
Rating Levels displaying 5 levels via a pie-chart
ii.
Merit Increase distribution and
iii.
Percent of Total Budget displayed via pie-chart