RETAIL SALES
a.
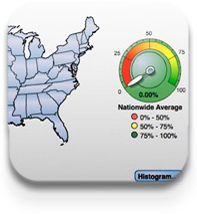
Dealer Revenue tab has three screens showing
i.
Nation-wide Revenue for the Current Week by each state, color-coded by revenue range
ii.
8 Top Dealers Stores and
iii.
8 Bottom Dealer Stores
b.
Lease Return tab has two screens
i.
Lease return by Series (department) which shows a pie-chart of models which were returned. Drill-down on any model/series shows reasons for returns along with return history
ii.
Top Lease Returns is a table that lists product/model/units/series (department). Filtered drill down is available to see a graphical representation.
iii.
The real-time weather map shows weather conditions over the country map, which can help explain the reasons for delays
c.
Customer Satisfaction has three screens - Country map showing results by States color-coded allowing drill down by States and also showing a histogram view of data
i.
8 Top Dealers and
ii.
8 Worst Dealers are also available along with drill-downs Customer Satisfaction history
d.
Customer Location show the power of drill-down over a country map, with states color-coded based on number of customers
i.
Drill-down to the state map shows the country map which further leads to zip code map. The final drill-down takes age demographics of the customers